Metrics and Instrumentation
StackStorm services and code base contain instrumentation with metrics in various critical places. This provides better operational visibility and allows operators to detect various infrastructure or deployment related issues (e.g. long average duration for a particular action could indicate an issue with that action or similar).
Configuring and Enabling Metrics Collection
Note
This feature was added and is available in StackStorm v2.9.0 and above.
By default metrics collection is disabled. To enable it, you need to configure metrics.driver
and depending on the driver, also metrics.host and metrics.port option in
/etc/st2/st2.conf.
Right now, the only supported driver is statsd. To configure it, add the following entries to
st2.conf:
[metrics]
driver = statsd
# Optional prefix which is prepended to each metric key. E.g. if prefix is
# "production" and key is "action.executions" actual key would be
# "st2.production.action.executions". This comes handy when you want to
# utilize the same backend instance for multiple environments or similar.

# statsd collection and aggregation server address
host = 127.0.0.1
# statsd collection and aggregation server port
port = 8125
After you have configured it, you need to restart all the services using st2ctl restart.
In case your statsd daemon is running on a remote sever and you have a firewall configured, you also need to make sure that all the servers where StackStorm components are running are allowed outgoing access to the configured host and port.
For debugging and troubleshooting purposes, you can also set driver to echo. This will cause
StackStorm to log under DEBUG log level any metrics operation which would have otherwise be performed
(increasing a counter, timing an operation, etc.) without actually performing it.
For a full list of config options, see the [metrics] section in the StackStorm sample
config here: https://github.com/StackStorm/st2/blob/master/conf/st2.conf.sample
Configuring StatsD
StackStorm statsd metrics driver is compatible with any service which exposes statsd compatible
interface for receiving metrics via UDP.
This includes original statsd service written in Node.js, but also compatible projects such as Telegraf and others.
This provides for a lot of flexibility and allows statsd service to submit those metrics to self hosted or managed graphite instance or to other compatible projects and services such as InfluxDB and hostedgraphite.
Configuring those services is out of scope of this documentation, because it’s very environment specific (aggregation resolution, retention period, etc.), but some sample configs which can help you get started with statsd and self hosted graphite and carbon cache instance can be found at https://github.com/StackStorm/st2/tree/master/conf/metrics.
Exposed Metrics
Note
Various metrics documented in this section are only available in StackStorm v2.9.0 and above.
This section describes which metrics are currently exposed by various StackStorm services.
Name |
Type |
Service |
Description |
|---|---|---|---|
st2.action.executions |
counter |
st2actionrunner |
Number of action executions processed by st2actionrunner service. |
st2.action.executions |
timer |
st2actionrunner |
How long it took to process (run) a particular action execution inside st2actionrunner service. |
st2.action.executions.calculate_result_size |
timer |
st2actionrunner |
How long it took to update result size in the database. |
st2.action.executions.process.<status> |
counter |
st2actionrunner |
Number of action executions processed by st2actionrunner service for a particular status. |
st2.action.executions.process.<status> |
timer |
st2actionrunner |
How long it took to fully process a request inside st2actionrunner for a particular status. |
st2.action.executions.update_status |
timer |
st2actionrunner |
How long it took to update execution and live action status and result in the database. |
st2.action.executions.update_liveaction_db |
timer |
st2actionrunner |
How long it took to update / store LiveActionDB model in the database. |
st2.action.executions.update_execution_db |
timer |
st2actionrunner |
How long it took to update / store ActionExecutionD Bmodel in the database. |
st2.action.<action ref>.executions |
counter |
st2actionrunner |
Number of action execution for a particular action processed by st2actionrunner. |
st2.action.<action ref>.executions |
timer |
st2actionrunner |
How long it took to process (run) action execution for a particular action inside st2actionrunner. |
st2.action.executions.<execution status> |
counter |
st2actionrunner |
Number of executions in a particular state (succeeded, failed, timeout, delayed, etc). |
st2.rule.processed |
counter |
st2rulesengine |
Number of rules (trigger instances) processed by st2rulesengine service. |
st2.rule.processed |
timer |
st2rulesengine |
How long it took to process a particular rule (trigger instance) inside st2rulesengine. |
st2.rule.<rule ref>.processed |
counter |
st2rulesengine |
Number of particular rules processed by st2rulesengine. |
st2.rule.matched |
counter |
st2rulesengine |
Number of trigger instances which matched a rule (criteria). |
st2.rule.<rule ref>.matched |
counter |
st2rulesengine |
Numbers of trigger instances which matched a particular rule (criteria). |
st2.scheduler.handle_execution |
counter |
st2scheduler |
Number of executions handled by st2scheduler. |
st2.scheduler.handle_execution |
timer |
st2scheduler |
How long it took to handle a particular execution by st2scheduler. |
st2.trigger.<trigger ref>.processed |
counter |
st2rulesengine |
Number of particular triggers processed by st2rulesengine. |
st2.trigger.<trigger ref>.processed |
timer |
st2rulesengine |
How long it took to process a particular trigger inside st2rulesengine. |
st2.orquesta.workflow.executions |
counter |
st2workflowengine |
Number of workflow executions processed by st2workflowengine. |
st2.orquesta.workflow.executions |
timer |
st2workflowengine |
How long it took to process a particular workflow execution inside st2workflowengine. |
st2.orquesta.action.executions |
counter |
st2workflowengine |
Number of executions processed for workflow task executions by st2workflowengine. |
st2.orquesta.action.executions |
timer |
st2workflowengine |
How long it took to process a particular workflow task execution inside st2workflowengine. |
st2.{auth,api,stream}.request.total |
counter |
st2auth, st2api, st2stream |
Number of requests processed by st2auth / st2api / st2stream. |
st2.{auth,api,stream}.request |
counter |
st2auth, st2api, st2stream |
Number of requests processed by st2auth / st2api / st2stream. |
st2.{auth,api,stream}.request |
timer |
st2auth, st2api, st2stream |
How long it took to process a particular HTTP request. |
st2.{auth,api,stream}.request.method.<method> |
counter |
st2auth, st2api, st2stream |
Number of requests with particular HTTP method processed by st2auth / st2api / st2stream. |
st2.{auth,api,stream}.request.path.<path> |
counter |
st2auth, st2api, st2stream |
Number of requests to a particular HTTP path (controller endpoint) processed by st2auth / st2api / st2stream. |
st2.{auth,api,stream}.response.status.<status code> |
counter |
st2auth, st2api, st2stream |
Number of requests which resulted in a response with a particular HTTP status code. |
st2.stream.connections |
gauge |
st2stream |
Number of open connections to the stream service. |
st2.notifier.action.executions |
counter |
st2notifier |
Number of action executions processed by st2notifier. |
st2.notifier.action.executions |
timer |
st2notifier |
How long it took to process a particular action execution by st2notifier. |
st2.notifier.apply_post_run_policies |
counter |
st2notifier |
Number of post run policies applied by st2notifier. |
st2.notifier.apply_post_run_policies |
timer |
st2notifier |
How long it took to apply post run policies processed by st2notifier. |
st2.notifier.notify_trigger.dispatch |
counter |
st2notifier |
Number of notify triggers dispatched by st2notifier. |
st2.notifier.notify_trigger.dispatch |
timer |
st2notifier |
How long it took to dispatch notify trigger for an execution. |
st2.notifier.notify_trigger.post |
counter |
st2notifier |
Number of notify triggers processed by st2notifier. |
st2.notifier.notify_trigger.post |
timer |
st2notifier |
How long it took to process / post notify trigger for an execution. |
st2.notifier.generic_trigger.dispatch |
counter |
st2notifier |
Number of generic notify triggers dispatched by st2notifier. |
st2.notifier.generic_trigger.dispatch |
timer |
st2notifier |
How long it took to dispatch generic notify trigger for an execution. |
st2.notifier.generic_trigger.post |
counter |
st2notifier |
Number of generic notify triggers processed by st2notifier. |
st2.notifier.generic_trigger.post |
timer |
st2notifier |
How long it took to process generic notify trigger for an execution. |
st2.notifier.transform_message |
timer |
st2notifier |
How long a “transform_message” function call took for a particular notify trigger. |
st2.notifier.transform_data |
timer |
st2notifier |
How long a “transform_data” function call took for a particular notify trigger. |
Depending on the metric backend and metric type, some of those metrics will also be sampled,
averaged, aggregated and converted into a rate (operations / seconds for counter metrics), etc.
Keep in mind that for the counter metrics, statsd automatically calculates rates. If you are interested in more than a rate (events per second), you will need to derive those metrics from the raw “count” metric.
For example, if you are interested in a total number of executions scheduled or a total number of
API requests in a particular time frame, you would use integral() graphite function (e.g.
integral(stats.counters.st2.action.executions.scheduled.count) and
integral(stats.counters.st2.api.requests.count)).
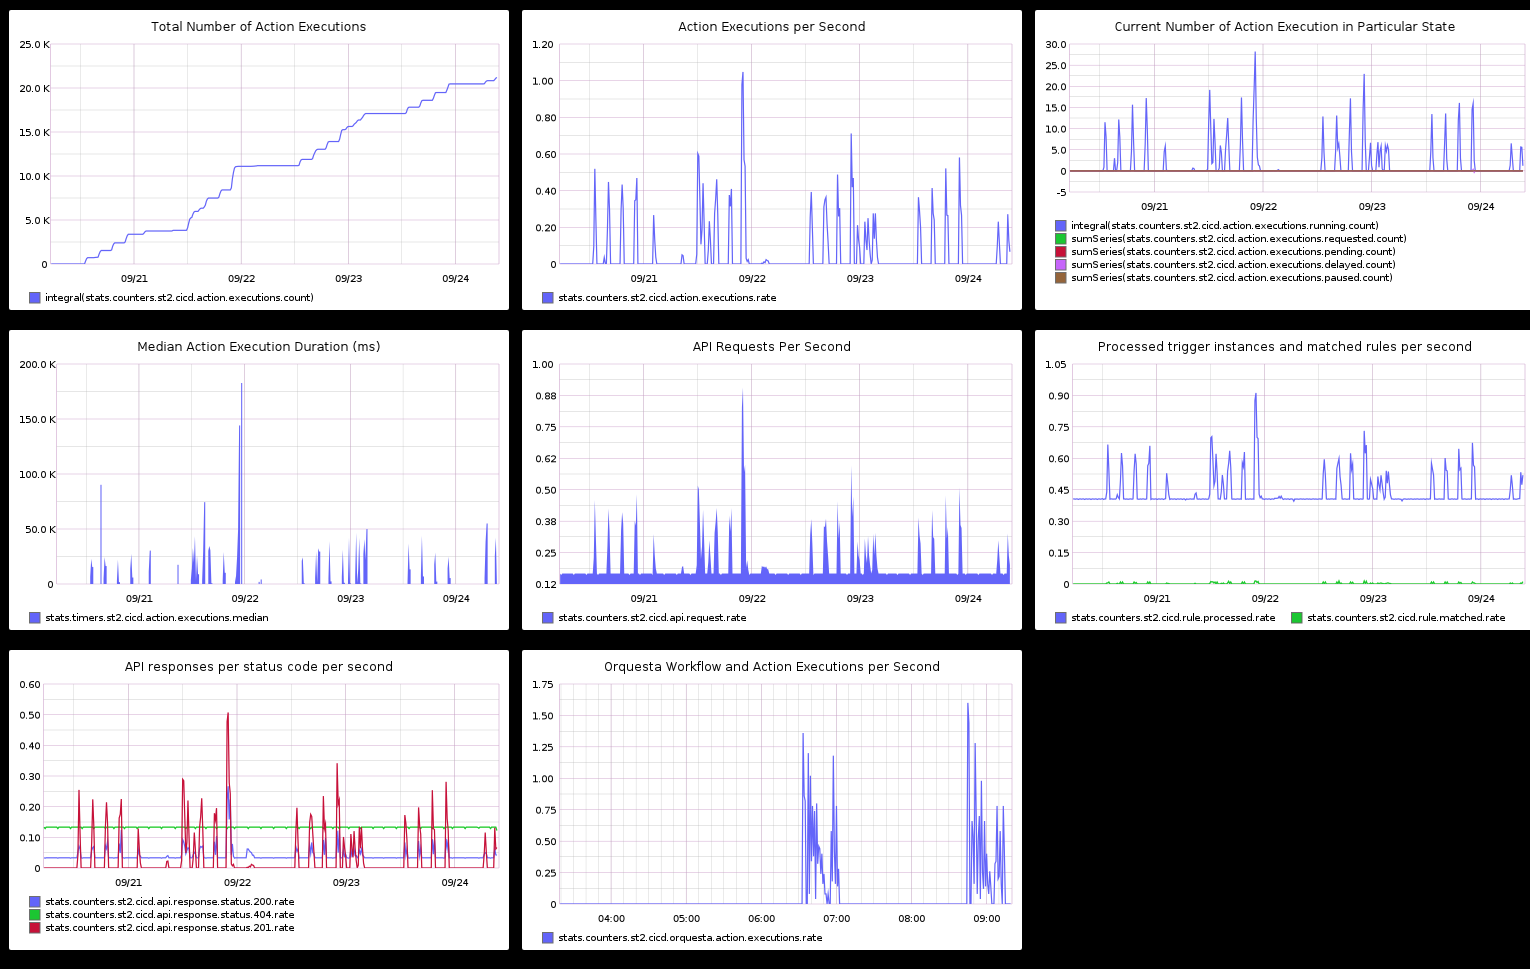
Example Graphite Dashboard
Below you can find code for an example Graphite dashboard which contains most of the common graphs you need to have a good operational visibility into StackStorm deployment.
[
  {
    "target": [
      "integral(stats.counters.st2.<prefix>.action.executions.count)"
    ],
    "title": "Total Number of Action Executions",
    "height": "308",
    "width": "586"
  },
  {
    "target": [
      "stats.counters.st2.<prefix>.action.executions.rate"
    ],
    "title": "Action Executions per Second",
    "height": "308",
    "width": "586"
  },
  {
    "target": [
      "integral(stats.counters.st2.<prefix>.action.executions.running.count)",
      "sumSeries(stats.counters.st2.<prefix>.action.executions.requested.count)",
      "sumSeries(stats.counters.st2.<prefix>.action.executions.pending.count)",
      "sumSeries(stats.counters.st2.<prefix>.action.executions.delayed.count)",
      "sumSeries(stats.counters.st2.<prefix>.action.executions.paused.count)"
    ],
    "title": "Current Number of Action Execution in Particular State",
    "height": "495",
    "width": "798"
  },
  {
    "logBase": "",
    "target": [
      "stats.timers.st2.<prefix>.action.executions.median"
    ],
    "title": "Median Action Execution Duration (ms)",
    "areaMode": "stacked",
    "minorY": "",
    "height": "469",
    "width": "754"
  },
  {
    "logBase": "",
    "target": [
      "stats.counters.st2.<prefix>.api.request.rate"
    ],
    "title": "API Requests Per Second",
    "areaMode": "stacked",
    "minorY": "",
    "height": "308",
    "width": "586"
  },
  {
    "target": [
      "stats.counters.st2.<prefix>.rule.processed.rate",
      "stats.counters.st2.<prefix>.rule.matched.rate"
    ],
    "title": "Processed trigger instances and matched rules per second",
    "height": "308",
    "width": "586"
  },
  {
    "target": [
      "stats.counters.st2.<prefix>.api.response.status.200.rate",
      "stats.counters.st2.<prefix>.api.response.status.404.rate",
      "stats.counters.st2.<prefix>.api.response.status.201.rate"
    ],
    "title": "API responses per status code per second",
    "height": "308",
    "width": "586"
  },
  {
    "target": [
      "stats.counters.st2.<prefix>.orquesta.action.executions.rate"
    ],
    "title": "Orquesta Workflow and Action Executions per Second",
    "height": "331",
    "width": "697"
  }
]
Keep in mind that some of the graphs such as “current number of executions in a particular state during a particular point in time” and “total counts for a particular execution state” are derived from the raw metric values.
Pushing metrics to InfluxDB
It is possible to gather the StatsD data with Telegraf to push them to InfluxDB. The StatsD data are formatted in a different way than InfluxDB usually, so we can use the template feature that is availabie in the Telegraf StatsD importer to reformat them to something more convenients (with flags, etc..)
Configure your InfluxDB and Telegraf InfluxDB output as usual, then on the StatsD input in Telegraf, you can specify the following configuration
 # Statsd UDP/TCP Server
 [[inputs.statsd]]
   protocol = "udp"
   max_tcp_connections = 250
   tcp_keep_alive = false
   service_address = ":8125"
   delete_gauges = true
   delete_counters = true
   delete_sets = true
   delete_timings = true
   percentiles = []
   metric_separator = "_"
   parse_data_dog_tags = false
   datadog_extensions = false

   templates = [
        "st2.action.executions.* measurement.measurement.measurement.type",
        "st2.action.*.*.executions measurement.measurement.pack.action.field",
        "st2.amqp.pool_publisher.publish_with_retries.* measurement.measurement.measurement.measurement.field",
        "st2.amqp.publish.* measurement.measurement.measurement.field",
        "st2.*.request.method.* measurement.measurement.measurement..method",
        "st2.*.request.path.* measurement.measurement.measurement..path",
        "st2.*.response.status.* measurement.measurement.measurement.status",
        "st2.rule.*.*.* measurement.measurement.pack.rule.field",
        "st2.rule.* measurement.measurement.field",
        "st2.trigger.*.*.processed measurement.measurement.pack.name.flag",
        "st2.trigger.*.*.*.*.processed measurement.measurement.pack.name.name.name.flag",
        "st2.notifier.* measurement.measurement.notifier",
        "st2.orquesta.*.*, measurement.measurement.field.measurement",

   ]

   allowed_pending_messages = 10000
   percentile_limit = 1000
Pushing metrics to Prometheus via the statsd_exporter
Prometheus provides a service called Statsd Exporter which receives data in the StatsD format and acts as a scrape target for Prometheus.
This exporter enables to make the st2 metrics available to Prometheus and other monitoring solutions that are able to scrape Prometheus targets (i.e. Zabbix).
While the README at https://github.com/prometheus/statsd_exporter provides the latest overview, metric mapping and service configuration https://github.com/prometheus/statsd_exporter#using-docker shows an example how to deploy the service using the prometheus/statds_exporter docker image.
The configuration examples below rely on the statsd_exporter default port configuration:
Port |
Purpose |
|---|---|
8125/udp |
receive metrics in the statsd format |
9102/tcp |
expose the web interface and generated Prometheus metrics |
Note that Docker must expose the ports on a (public) interface if StackStorm is not running in the same containerized environment.
st2 configuration:
[metrics]
driver = statsd
# Optional prefix which is prepended to each metric key. E.g. if prefix is
# "production" and key is "action.executions" actual key would be
# "st2.production.action.executions". This comes handy when you want to
# utilize the same backend instance for multiple environments or similar.

# statsd collection and aggregation server address
host = <statsd_exporter_address>
# statsd collection and aggregation server port
port = 8125
Prometheus configuration
Prometheus needs to know the new scrape target - the statsd exporter.
Example scrape config:
scrape_configs:
  - job_name: 'st2-statsd-metrics'
    static_configs:
      - targets:
        - "statsd-exporter:9102"
Replace statsd-exporter by the host name or IP address of the host / container running the statsd exporter service.